Where Are Americans Moving?
First Trust Economics
On Tuesday, the Census Bureau released its vintage 2025 population estimates, showing that U.S. population growth slowed markedly over the past year. Between July 1, 2024 and July 1, 2025, the population increased by just 1.8 million people, or 0.5%. This slowdown was driven primarily by a sharp and historically significant decline in net international migration, which fell to 1.3 million from July 2024 through June 2025, down from 2.8 million in the prior year. Each year, the U.S. Census Bureau estimates population changes resulting from three forces: births, deaths, and migration—both domestic and international. These components are measured through the Census Bureau’s Population Estimates Program and applied to a base population to produce updated annual estimates. In this week’s “Three on Thursday,” we narrow the focus to solely domestic net migration between states, highlighting which states are attracting residents—and which are seeing people leave. To put today’s migration patterns into clearer context, we present three tables below that detail the latest domestic state-level flows and shifts across the country.
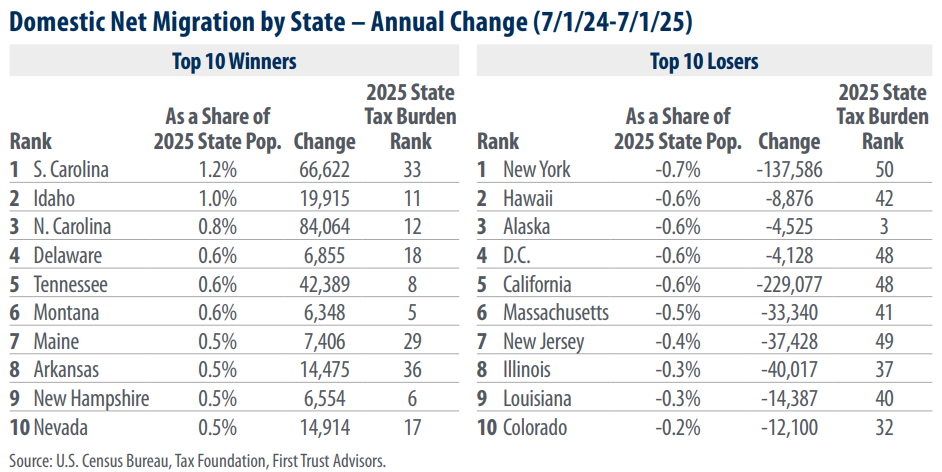
In the most recent annual data available from July 1, 2024 to July 1, 2025, South Carolina once again experienced the highest proportion of domestic net migration relative to its population, standing at 1.2%. Conversely, New York saw the most significant loss, accounting for -0.7% of the state’s population. The predominant factors influencing these migration trends appear to be lower tax burdens and lower cost of living. Examining the tax landscape, the Tax Foundation gauges a state’s tax burden by considering state and local taxes paid by residents divided by the state’s share of net national product. On their scale, where 1 is the least tax-burdened state and 50 is the most tax burdened state, the top 10 domestic migration winners boasted an average tax burden ranking of 18. In contrast, the top 10 domestic migration losers exhibited an average tax burden ranking of 39.
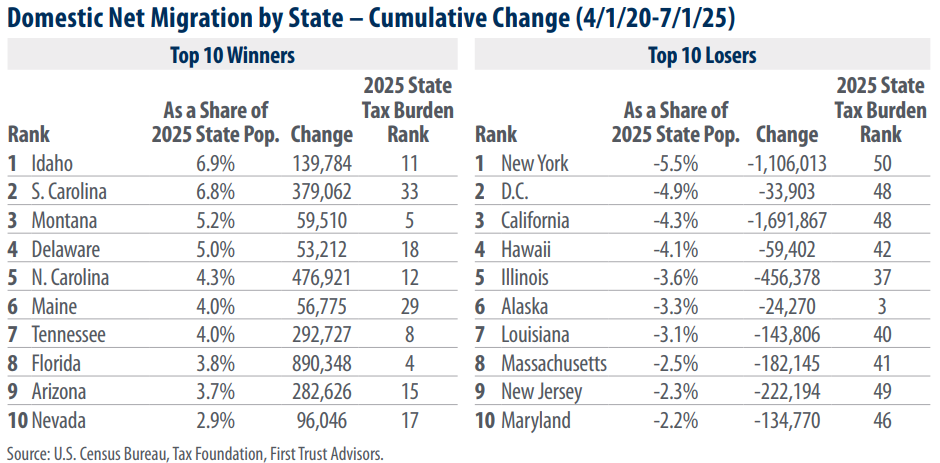
Many believed the migration patterns during COVID would reverse as people returned to work, but that has not happened. The data reveals a sustained trend towards states with lower taxes and lower cost of living. Analyzing Census data from April 1, 2020, through July 1, 2025, shows Idaho led the way gaining 6.9% in domestic net migration as a share of its state population over that period. On the flip side, New York faced a substantial loss, with a 5.5% decrease in domestic net migration as a share of its state population. In terms of sheer numbers, Florida emerged as the leader in net domestic migration, welcoming 890,348 individuals, while California witnessed the largest outflow, losing 1.692 million residents. The top 10 winners in domestic migration over this period displayed an average tax burden ranking of 15. Conversely, the top 10 losers in domestic migration exhibited an average tax burden ranking of 40.
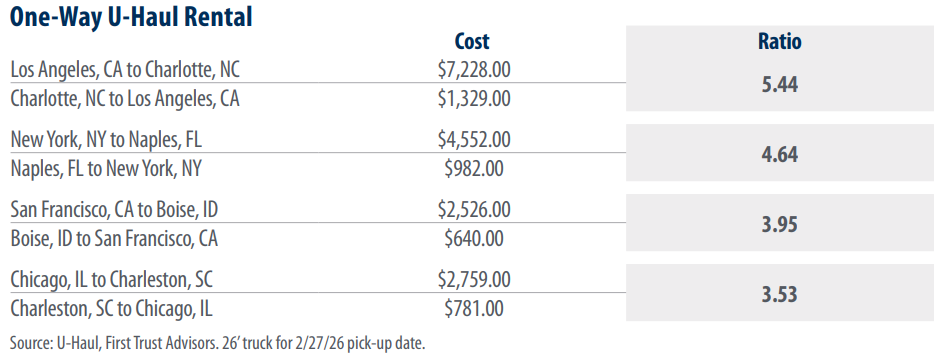
One of our favorite indicators of migration patterns is the price of renting a U-Haul to move from one city to another. On the U-Haul website, you can download quotes for these rentals and compare outbound and inbound pricing. If the price is higher for one direction relative to the other, it is a solid measure of supply and demand. U-Haul tries to develop a pricing scheme that keeps the total supply of usable vehicles roughly stable at each location and will lower or raise the price, depending on direction, to recover excess vehicles if volumes don’t balance. For instance, taking a 26 ft. U-Haul from San Francisco, CA to Boise, ID incurs a cost of $2,526. In contrast, picking up the same sized U-Haul in Boise and driving it to San Francisco costs only $640, a mere quarter of the price! This means many more people are moving from San Francisco to Boise than are moving from Boise to San Francisco.
This report was prepared by First Trust Advisors L. P., and reflects the current opinion of the authors. It is based upon sources and data believed to be accurate and reliable. Opinions and forward looking statements expressed are subject to change without notice. This information does not constitute a solicitation or an offer to buy or sell any security
Haddonfield Financial Planning, L.L.C. (“HFP”) believes that the content provided by third parties and/or linked content is reasonably reliable and does not contain untrue statements of material fact or materially misleading information. This third-party content may be dated.